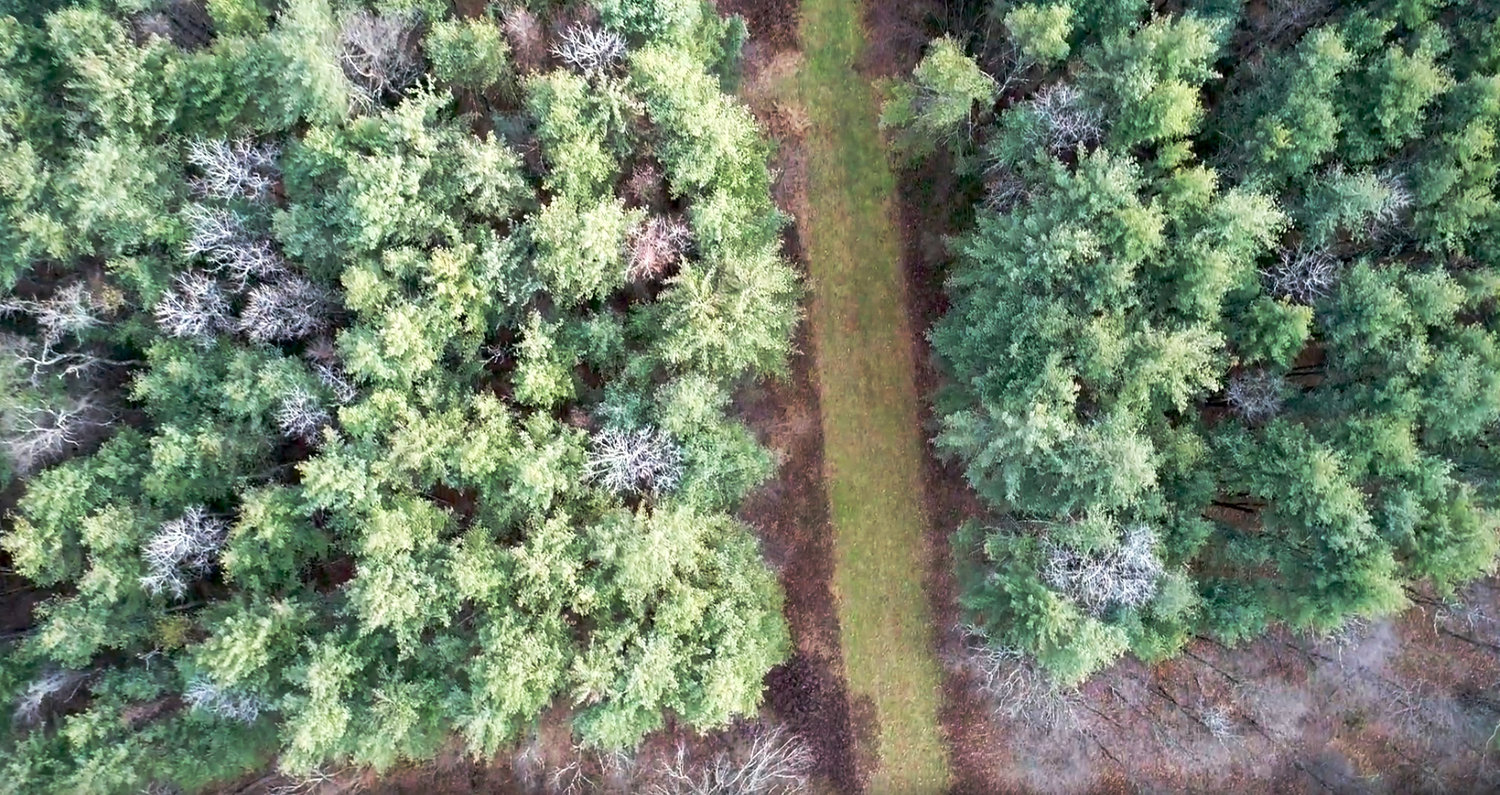
Under the promise of “energy independence” the United States has seen an unprecedented rollout of shale gas infrastructure throughout the past decade. As late as 2005, this shale gas was not a significant feature in the Northeast Region. Only ten years later, hundreds of local communities and thousands of acres of heavily forested, endangered ecosystems are increasingly threatened. The encroachment of this infrastructure includes pipelines, compressor stations and shale gas plants.
Northeast Region Pipelines + Marcellus Shale Extent. Source: eia.gov pipelines dataset, mapped by Stephen Metts
The project website will be repository for all of the media assets – remote sensing, spatial analysis & maps, drone imagery, infographics and shareable memes – in addition to other visual media that helps explain shale gas systems and risks of its infrastructure. A related Facebook page will share these as well as other media assets developed by community partners. The website will document community strategies and tactics for public intervention in the permitting process and feature a robust annotated bibliography that focuses on the regional impacts in the Northeast, aggregated climate change impacts, public safety and health risks.
Termed “natural gas” by the oil and gas industry, this fossil fuel is marketed as a “clean energy” or “bridge fuel.” Recent scientific analysis, however, has shown significant impacts of increased methane on climate change. Methane, which makes up 93% of “natural gas” has a greater impact on global warming than “dirty coal”. In New York, which banned fracking in 2014, the onslaught of related gas infrastructure continue to grow, with more and more pipelines, compressor stations and power plants.
Hazardous chemicals are utilized throughout this energy infrastructure, creating “sacrifice zones,” communities impaired by environmental damage and ill health effects. Unsuspecting local communities are reassured by industry that there are no negative impacts. Struggling rural counties and their townships are promised economic opportunities and paid token donations to municipal governments, local services and organizations. Only later do these communities discover the threat these industrial operations pose to their own health.
Visualizing Pipeline Impacts seeks to make visual both the complexities of shale gas infrastructure, most notably in the Northeast Region, as well as offer media tools for documenting local impacts.
Critical questions for this project include:
- How can the complexity of this problem be communicated in ways that are visual, memorable and scientifically sound?
- What effective strategies can local communities employ to oppose further shale gas infrastructure expansion?
- How can open-source, mobile technologies be used for documenting impending impacts upon lands, waterbodies and endangered species?
- What open-source apps could assist community intervenors by providing direct access to critical, yet hard-to-access documents related to shale gas infrastructure expansion?
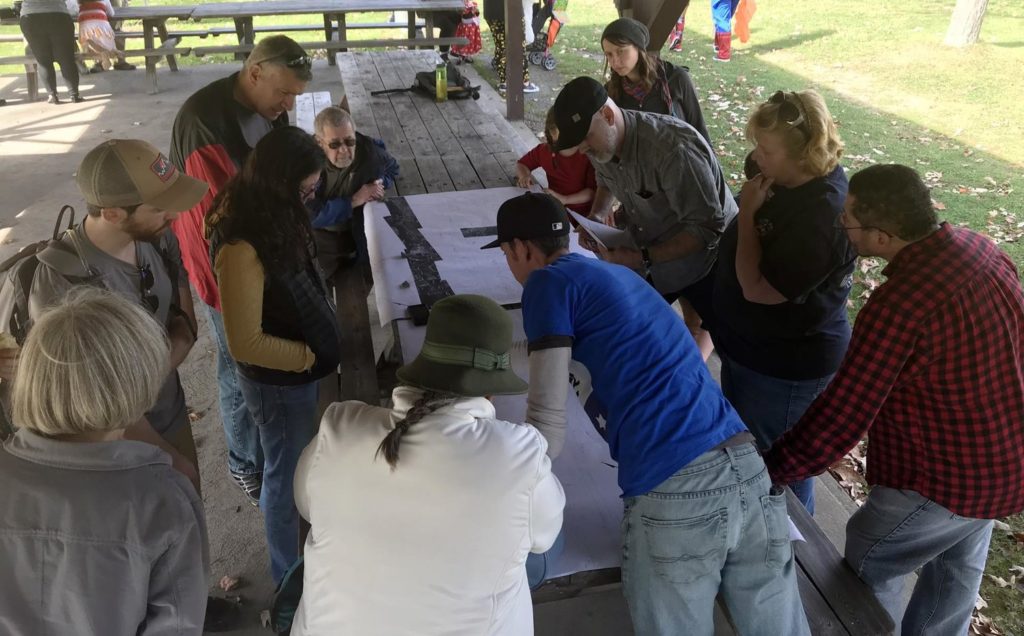
Toward this effort, professors Jess Irish (Parsons, School of Art, Media & Technology) and Stephen Metts (Milano, School of International Affairs) have collaborated with several community groups in the Northeast region (Delaware Riverkeeper Network, Protect Orange County, Sullivan County Residents Against Millennium, and Concerned Citizens For Hudson Valley) to oppose further expansion of gas infrastructure, develop specific tools for documenting local impacts and visualize multiple components of the hazards the shale gas industry poses.

The two open-source technology tools they’re developing include: Habitat Impact Mapper (HIM) and Pipeline Information Scraper (PIS), which are straightforward, effective tools for capturing information that can be critical for communities accurately documenting shale gas infrastructure expansion in their region and local communities. While both tools will be generally documented on the VzPI.org website, they will not be fully open and accessible online. Rather, they will be strategically disseminated through vetted community partnerships to ensure these engagements are not infiltrated by the shale gas industry.

References:
2. Howarth, R; A bridge to nowhere: methane emissions and the greenhouse gas footprint of natural gas, Energy Science & Engineering, April 2014.

