
One of the critical questions of the Visualizing Pipeline Impacts Collaboratory Project is how can open-source, mobile technologies be used for documenting impending environmental impacts from pipeline projects? Impending as in yet to occur and not fully disclosed – the oil and gas industry is in no rush to either proffer precise location data for proposed projects nor detail fully direct, indirect and cumulative impacts from projects. Paradoxically, through public, open-source, asymmetrical means both the path and impact of impending pipeline projects can be made visible before trees are downed and trenches are dug.
Prior to the Visualizing Pipeline Impacts Collaboratory Project, a model open-source mapping tool was developed with assistance of the 2016 TEDC Faculty Grant at The New School. Entitled Mobilizing Maps for Sustainable Communities, in partnership with Delaware Riverkeeper Network and developer and former New School student, Darren Klein, this effort took form as part database, part map, all designed with the intent to capture and make visible impacts due fracked gas pipelines, largely in high-value forest cover.
Entitled Habitat Impact Mapper (HIM), this tool was developed into a fully integrated cross-platform mobile application. The advance of HIM was its ability to locate the user atop an unbuilt (invisible) pipeline alignment; show the user’s position as well as provide a data interface to log environmental impacts due to impending pipeline construction. Specific application features included:
- Run as an application in a native browser with full access to the device GPS chip in order to capture and log a volunteer’s precise location.
- Deliver a simple yet effective map interface allowing volunteers to easily plot their exact location relative to a proposed but as of yet, physically nonexistent pipeline alignment.
- An easy data intake form that can be submitted after field monitoring to a cloud database, easily accessed and administered further by DRN.
Through subsequent field testing and use of the HIM app, it became apparent that the tool’s ability to quickly and easily locate volunteer users in-situ along proposed pipeline alignments was a critical advance. Resolving field mapping issues quickly and effectively allowed users to fully concentrate on observation and data intake for environmental resources at risk.
The HIM app was first deployed on the PennEast pipeline project, a massive 36-inch pipeline, approximately 120 miles from end to end, crossing 4 Pennsylvania counties on its way underneath the Delaware River into 2 New Jersey counties. An ongoing and significant complication of the project has been the sheer lack of impact data provided by the applicant to both state and federal agencies:
“They have little or no data…They only have data for one-third of the route.’’
Tom Gilbert, Rethink Energy NJ and the New Jersey Conservation Foundation. April 7, 2017
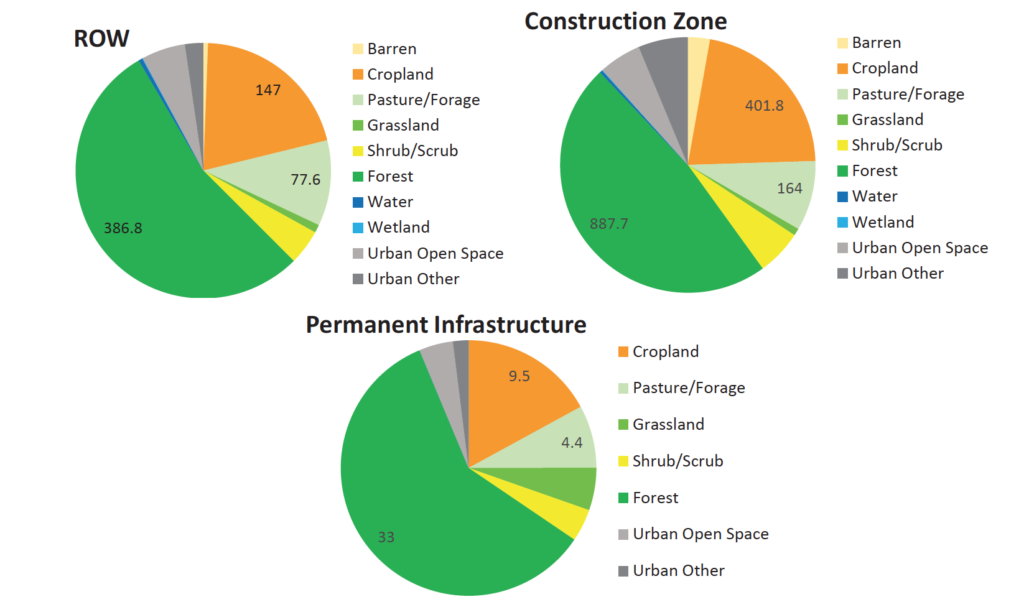
This lack of publically accessible data has become an imminent issue as PennEast was granted its Federal Energy Regulatory Commission (FERC) certificate January 2018, and is now proceeding to wholesale eminent domain actions on family farms and property, much of which has been held privately for generations. Independent desktop analysis for cumulative impacts through the efforts of DRN and Key-Log.economics LLC suggests that direct, indirect and cumulative impacts from the PennEast project could be dire. As the project crosses large swaths of high-canopy, high-value forest, streams, rivers and wetlands, untold species and habitat impacts are inevitable1.
While the PennEast project continues towards eminent domain proceedings, other northeastern pipelines continue unabated, much closer to full completion. One such project is located just northwest of New York City approximiately 75 miles – The Valley Lateral Project. Proposed by Millennium Pipeline Company, LLC (Millennium), this project makes up for its short distance of 7.8 miles through drawn-out controversy as it is designed to extend from Millennium’s existing main line pipeline north to the new 650 megawatt gas-powered Competitive Power Ventures (CPV) Valley Energy Center being constructed by CPV Valley, LLC in the Town of Wawayanda. This power plant is in fact the very one at the center of the Percoco Trial in New York City, a trial that focuses on alledged corrupt permitting and bribery between the Cuomo administration and CPV executives.
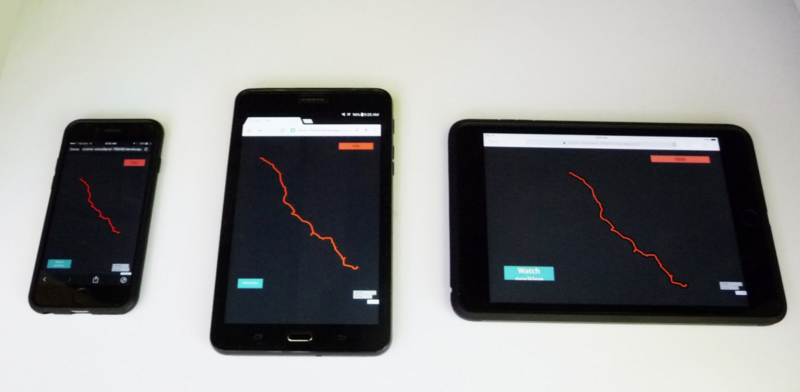
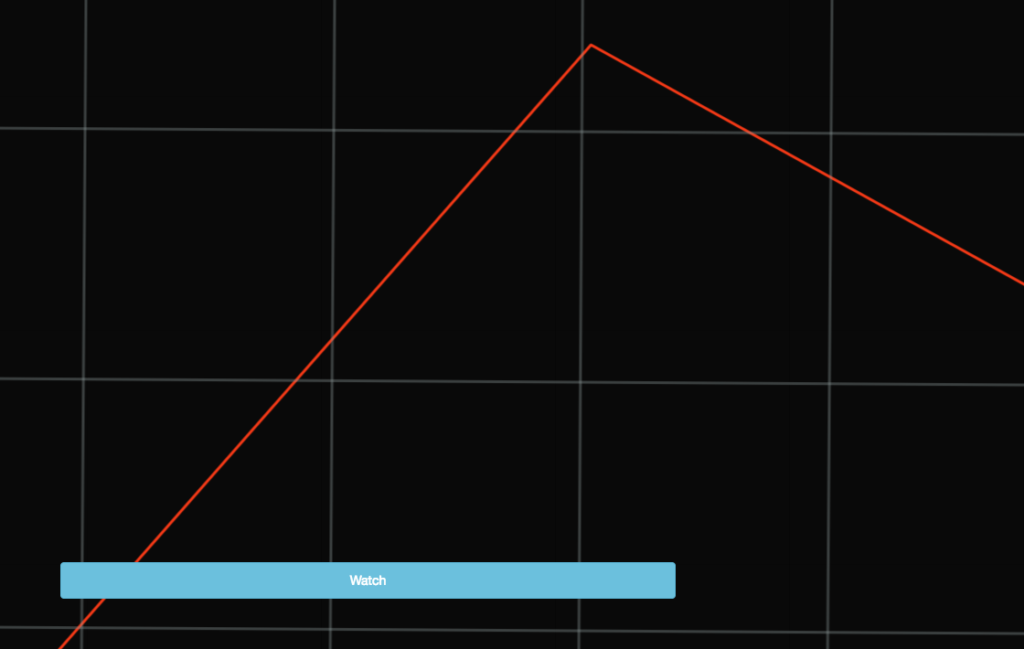
Under time constraints, the Visualizing Pipeline Impacts Collaboratory Project strategized the previous advances of the HIM app to quickly design and deliver a mobile map interface without the full database functionality of the HIM app. Named simply Pipeline Mapper2, this second project also locates the user atop the unbuilt (invisible) pipeline alignment in-situ in the field, utilizing various map scales to serve different levels of detail.
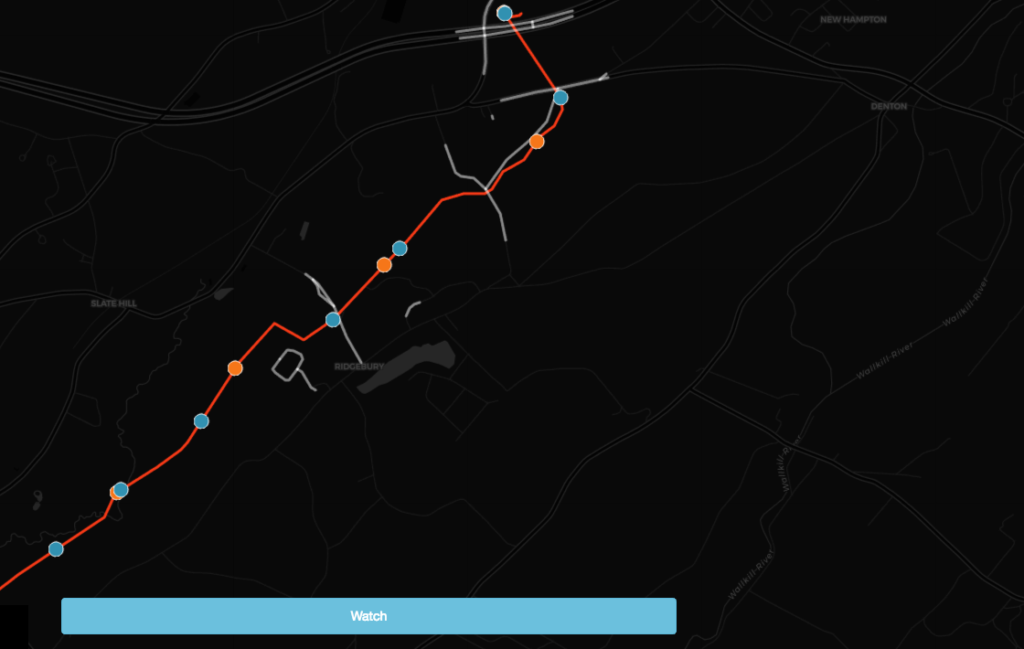
The Pipeline Mapper was deployed repeatedly in the Fall of 2017 to strategically map Shagbark Hickory trees (Carya ovata)which are protected habitat for two species of endangered bats – the Indiana Bat and the Northern long-eared Bat. In review of New York State Department of Conservation (NYSDEC) filings3 at FERC it was clearly evident that NYSDEC was not in full concurrence with the applicant and FERC’s determination of no significant impact for both bat species. Further, FOIA documents from the U.S. Fish & Wildlife Service (USFWS) show internal disagreement about impact analysis methods and its decision to not issue a formal consultation – an action which would have triggered much more specific impact analysis.
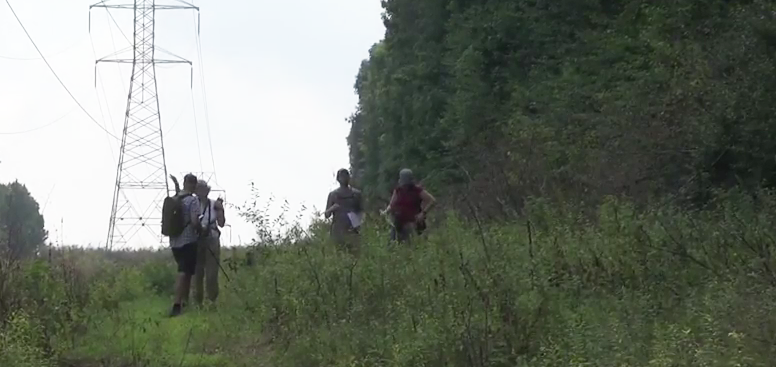
Given both state and federal agency disregard for full impact analysis of critical habitat for endangered bat species, a Pipeline Mapper team was activated, resulting in the mapping of dozens of undocumented Shagbark Hickory trees fully within the alignment and disturbance areas of the Valley Lateral Project.

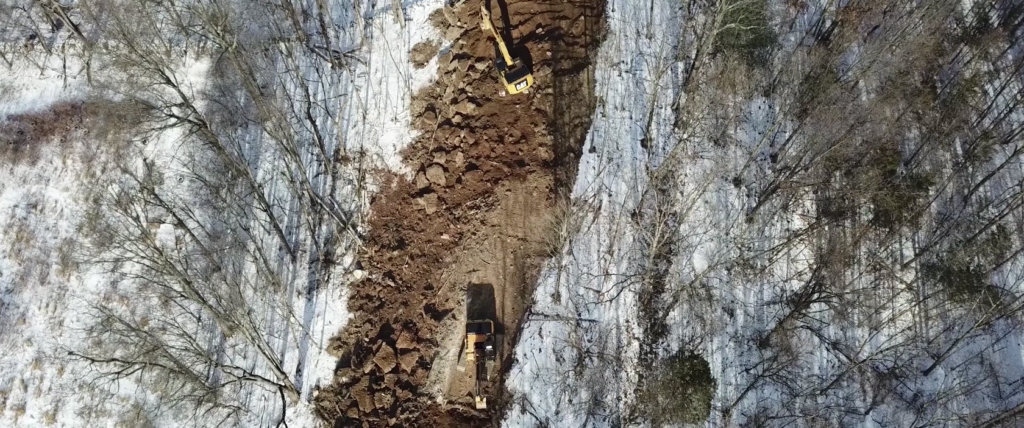
During the independent monitoring and mapping, each Shagbark Hickory tree was photographed and GPS tagged, stored in a repository and previewed in the image below. Its important to emphasize that the applicant, FERC, USFWS nor NYSDEC did any individual tree impact analysis. Rather, relatively coarse desktop satellite imagery analysis was conducted for overall forest canopy thresholds which by regulation must remain above 35%. It should be noted the current canopy in proximity to the pipeline alignment is typically not above 40%.
While the first deployment of the HIM app certainly has not stopped a regulatory process now turned to eminent domain proceedings in the case of the PennEast project; and the Pipeline Mapper was clearly unable to stop the destruction of the critical habitat of endangered species, both projects offer new ways to make visible the invisible prior to a pipeline project’s destructive path. In worst cases, they offer an important evidentiary record of what once was.
As our daily experiences surrounding important issues are increasingly conducted online and disembodied, opportunities for individuals and communities to locate themselves physically within fraught yet critical discourses surrounding intrusive energy infrastructure are both rare and urgently needed. Just this past week, a new study4 was published which found significant impacts to the Louisiana Waterthrush (Parkesia motacilla) from shale gas infrastructure development in habitat areas. Delicate bird and bat species are modern day ‘canaries in coal mines’ – we need independent, open-source tools to witness their warnings and seek protections for their increasingly perilous habitats.
References:
- Economics of the PennEast – Pipeline –http://keylogeconomics.com/projectsandpublications/penneastcosts/
- Pipeline Mapper application – https://pipeline-mapper.herokuapp.com/
- Millennium Pipeline responses to NYSDEC concerns regarding bat habitat thresholds – https://www.scribd.com/document/363070776/millennium-8-5-16
- Demographic response of Louisiana Waterthrush, a stream obligate songbird of conservation concern, to shale gas development- http://www.bioone.org/doi/10.1650/CONDOR-17-130.1