As unconventional gas drilling (fracking) and its transport infrastructure (pipelines) has surged over the past decade, research into their social costs and impacts continues to emerge. Risks and harms of fracking to human health have been well documented 1; studies of high-profile pipeline projects show concerning aggregated trends 2; and proximity to fracking infrastructure is a known property value impact 3. However, even as pipelines traverse hundreds of miles across rural landscapes bisecting significant acreage of farmlands, local and disaggregated impacts to individual farm parcels is just beginning to emerge.
The absence of significant documentation and research into farmland impacts is likely due to several factors. First, farmland by its very nature is situated in rural landscapes that are easily overlooked by the public at large. Second, the current fracking pipeline buildout is a very recent phenomena, barely more than a decade old. Farmers have, by and large, had little time to organize and bring impacts to the public’s attention. Third, while the Federal Energy Regulatory Commission (FERC) includes discussion of land uses in their environmental review process of proposed pipeline projects, it is largely perfunctory, fully accepting of pipeline applicant assurances that impacts will be temporary, usually limited to ‘one growing season’, if at all. There is no robust analysis of farmland impacts by federal and state agencies, and certainly little by pipelines themselves.
In spite of these challenges, several studies are now underway, and individual farm impacts are indeed starting to surface. In New Jersey, spanning 2008-2012, crop yield documentation was established at Fulper Farms which clearly demonstrates a spatial correlation with a pipeline alignment and low crop yield 4.
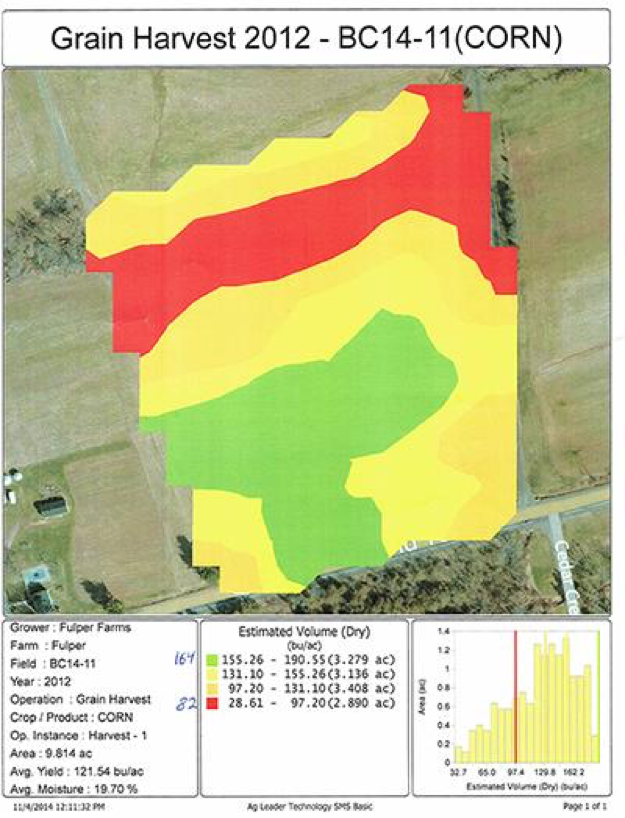
In Lancaster County, PA (2014), farmer Mervin D. Shenk documented low crop yields spatially correlated to a pipeline alignment on his corn fields. As Shenk states “My experience with pipelines is (productivity) is never the same over those areas.” 5 Also in 2014, Lancaster County, a gathering of farmers sponsored by the Lancaster Farmland Trust and Lancaster County Conservancy discussed easement agreement strategies with the proposed Williams Partners’ Atlantic Sunrise pipeline. One of the impact topics discussed was ‘heat bleed’ – as fracked gas pipelines are under significant pressure, invariably heat is produced which can impact crops, especially those requiring specific soil temperature ranges for optimum crop yield 6. In 2015, The College of Food, Agricultural, and Environmental Sciences at The Ohio State University began a new study for potential impacts of pipeline installations on farm soils. A particular feature of this study is the relatively large study sample size and duration- 20 to 30 farmers with a pipeline installation on farmland, monitoring crop yields for 3 to 5 years 7. In 2017, a S.W. Georgia farmer along the 515 mile Sabal Trail Pipeline has documented severe damage to his farm particularly from topsoil remediation practices by the pipeline LLC, Sabal Trail Transmission. This damage has remained largely unmitigated. As Randy Dowdy, the farmer states, “The project inspectors that should have been responsible for proper preventative measures to avert these problems and responsible for the restoration/reconstruction process are employees of the pipeline contractor, so whose best interest did they have in mind?” 8
More locally, a little over an hour north of New York City in the famed ‘Black Dirt Region’ 9 of Orange County, New York, one local farmer has been battling the Millennium Pipeline Company since 2008 when the Company installed its 182 mile mainline pipeline across the Southern Tier of New York. Farmers in the Black Dirt Region typically farm onions in the rare, unique peat soil formation of this region where the integrity of the topsoil has to be maintained. Following the installation of the Millennium mainline in 2008 at the farm of James Bastek, onion crops on the pipeline alignment have either failed completely or shown significant yield decrease compared to those areas of farmland that are untouched by the pipeline.
Prior to the formation of the Visualizing Pipeline Impacts project, New School faculty member Stephen Metts began working with then graduate student Natalia Gutierrez from The Environmental Policy and Sustainability Management, Milano to develop a mapping methodology to quantify impacts described by Bastek. As Natalia graduated, this work was continued by Metts through the Visualizing Pipeline Impacts project through meetings and interviews with Bastek.
In order to quantify the impacts, first the pipeline had to be accurately mapped via historical FERC application filings. Once mapped, the alignment right-of-way (ROW) of the pipeline trenched area & topsoil displacement area was determined. Finally, remote sensing techniques were deployed to ascertain crop vegetative cover both on and off the pipeline ROW. These three steps were then combined with on-the-ground as well as drone imagery qualitative methods to ascertain consistency of impacts across both quantitative and qualitative approaches.
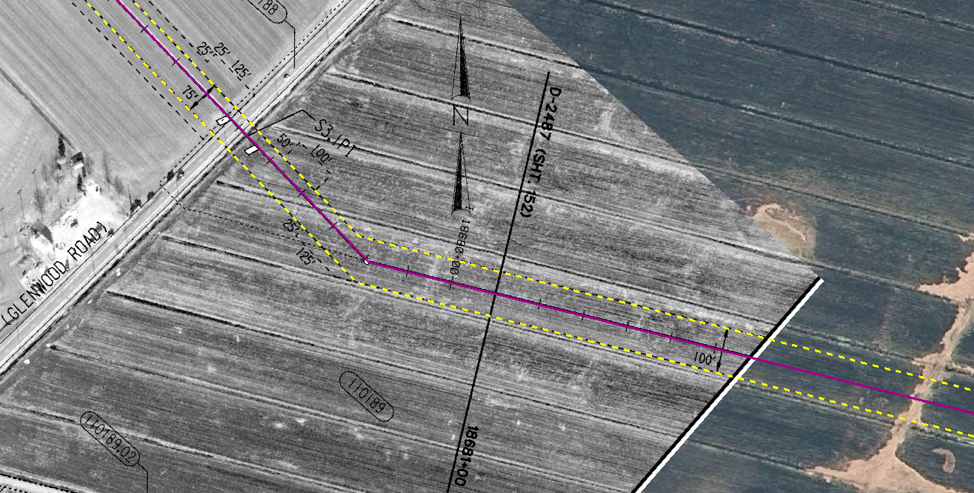
In order to determine the exact alignment of the Millennium Pipeline installed in 2008 across the Black Dirt region, a process of GIS georeferencing 10 was initiated using the original project alignment sheets culled from project’s FERC docket in conjunction with high resolution basemap imagery served from the NYS GIS Clearinghouse.
Once accomplished, the project alignment and ROW areas were determined from the georeferenced 2008 project alignment sheets producing the pipeline alignment features as well as ROW distances in vector format. This process was critical to gaining an exact recreation of the original pipeline installation so that both ON ROW and OFF ROW areas could be accessed.
Following the georeferencing and alignment mapping, remote sensing imagery techniques were employed. The specific analysis consisted of applying a normalized difference vegetation index (NDVI) 11 function onto high-resolution imagery during growth seasons. The unprocessed imagery product was procured from the USDA NAIP program which offers a near-infrared product of suitable spatial and temporal resolution. The final product chosen possesses a temporal resolution in the New York growing season dated 07/05/2011 at 0.5-meter spatial resolution. Although NDVI analysis was not performed for a pre-installment period as a temporally suitable near-infrared product is not readily available, a true color product from New York State’s Orthoimagery program was utilized for visual comparison to conditions prior to pipeline installment (2007).
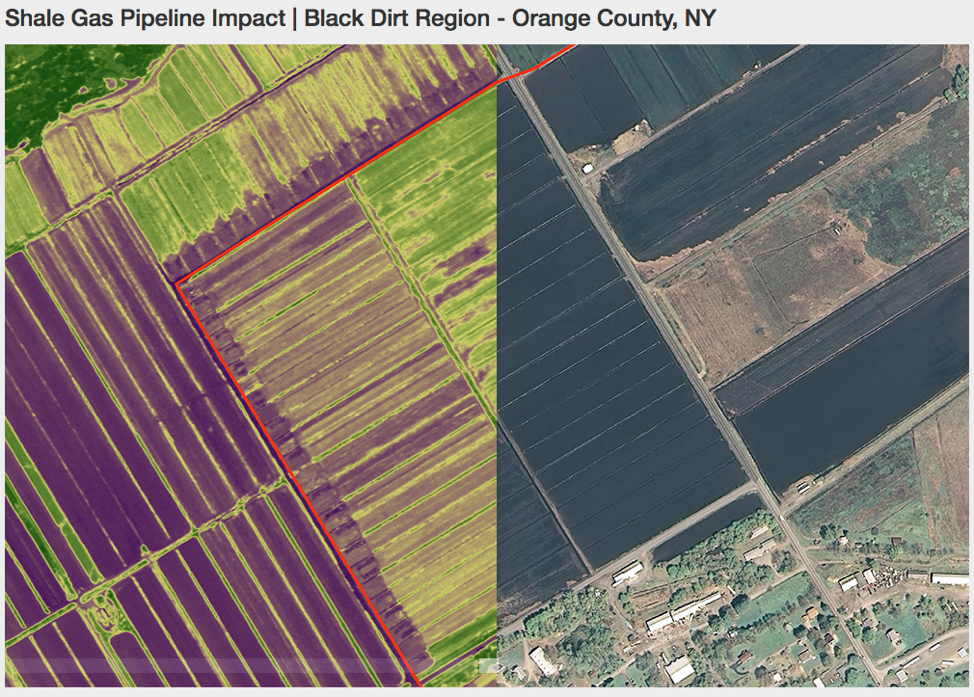
As seen in the NDVI processed imagery (left), there is a marked pattern of lower NDVI values (purples, less vegetative cover) both northeast as well as northwest of the red pipeline alignment as it crosses the Bastek farm. As this result has been derived from imagery with a temporal resolution at height of growing period, these lower values represent crop yield either diminished irrevocably or ‘behind’ schedule. This pattern is consistent approximately 50 feet outwards from the alignment where the Millennium Pipeline installment intersects with the Bastek farmland.
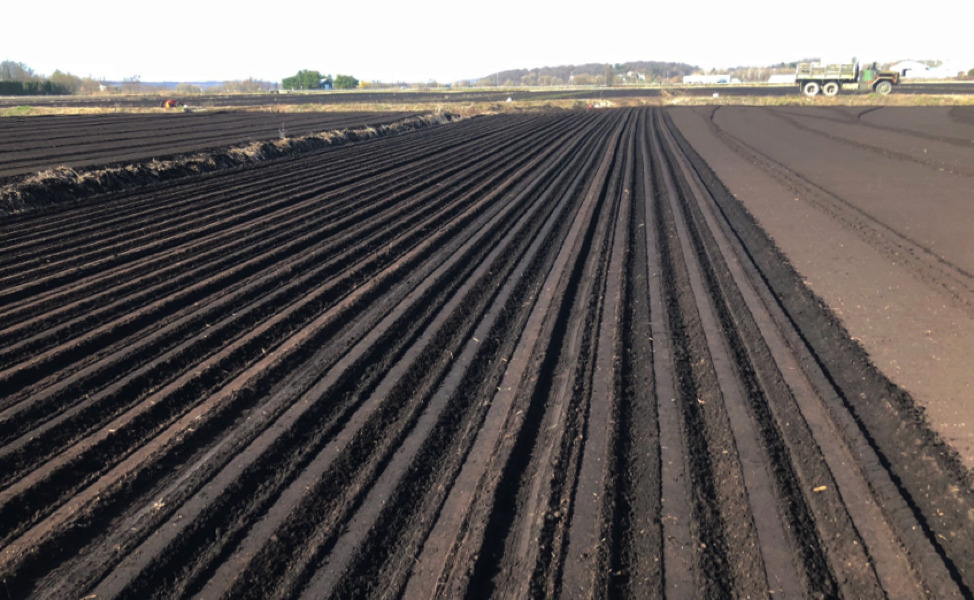
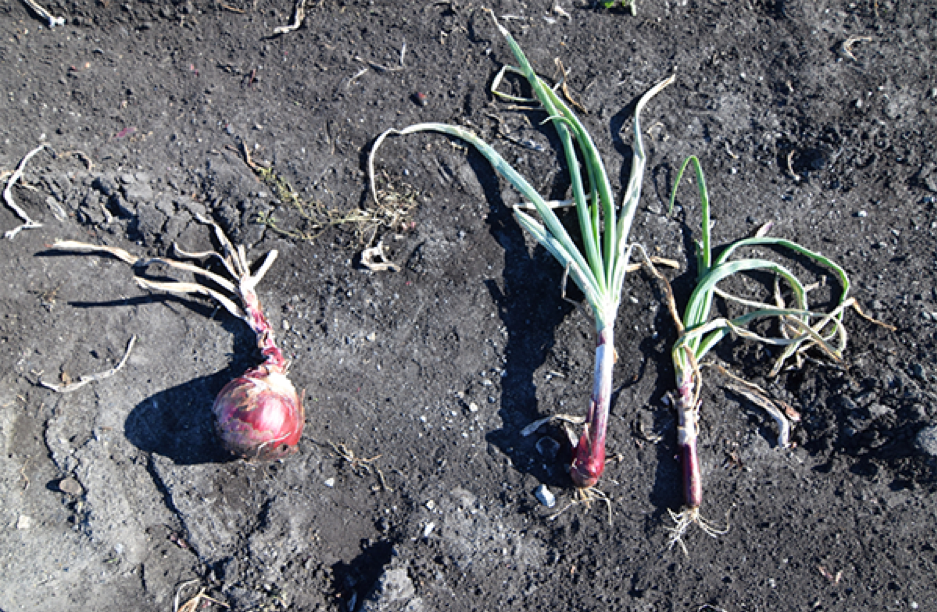
The quantified, remote-sensed results derived from the mapping methodology was then ground truthed through both photo documentation and drone imagery derived at the Bastek farm along the alignment ROW. Collected during the ‘harvest’ period at the end of the late Summer/early Fall growing season, a healthy crop yield would appear to be brownish, deadened vegetative cover with healthy, large onion bulbs. As seen in the following photograph, the crop yield at locations that do not intersect with the pipeline alignment are indeed characterized as brownish, deadened tops with robust onion bulbs at the bottom. However, crop yield atop the pipeline alignment is either completely missing or immature with greenish tops and attenuated bulb formation at the bottom. In effect, any crop yield produced atop the pipeline alignment ROW is severely immature and unviable for market.
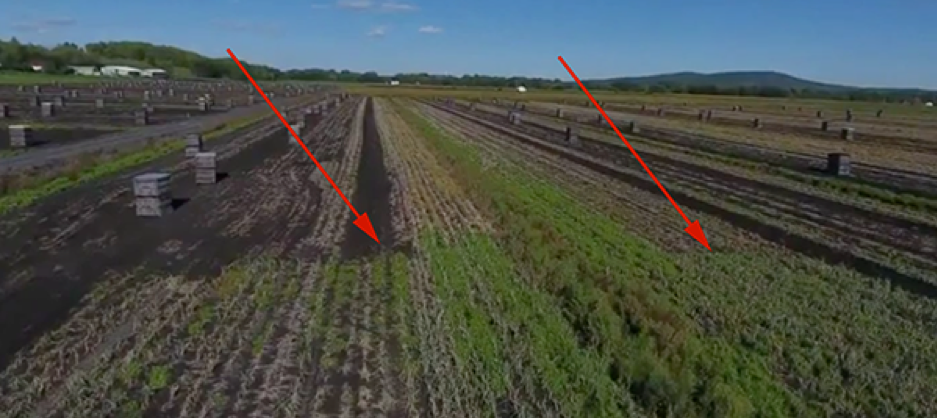
Utilizing drone camera imagery taken slightly above the pipeline ROW, the demarcation between typical harvest cover and that atop the pipeline alignment is clearly evident. As noted with red arrows in the following image, this demarcation is pronounced and clearly evident from the vantage point offered by drone imagery. This pattern is consistent with the finding of significant NDVI value differences between ON ROW and OFF ROW crop areas earlier in the growing season.
References:
- Concerned Health Professionals of NY – Compendium – Fifth Edition, March 2018
- Natural Gas Development and Transmission – Key-Log Economics LLC
- Proximity of Compressor Station Devalues Homes by as much as 50%
- Independent research conducted at Fulper Farms, New Jersey
- Lancaster County, PA farmer documents crop yield impacts for corn crops atop pipeline alignment
- [Pipeline easements anything but easy]
- Researchers Study the Potential Impact of Pipeline Installation on Farm Soil
- S.W Georgia Farm Devastated From Pipeline Construction
- Black Dirt Region Farming
- Georeferencing
- NDVI
- Millennium Pipeline LLC is owned TransCanada (47.5% stake), National Grid (26.25% stake), and DTE Energy (26.25% stake)
- Information derived from Metts interview with Bastek.